
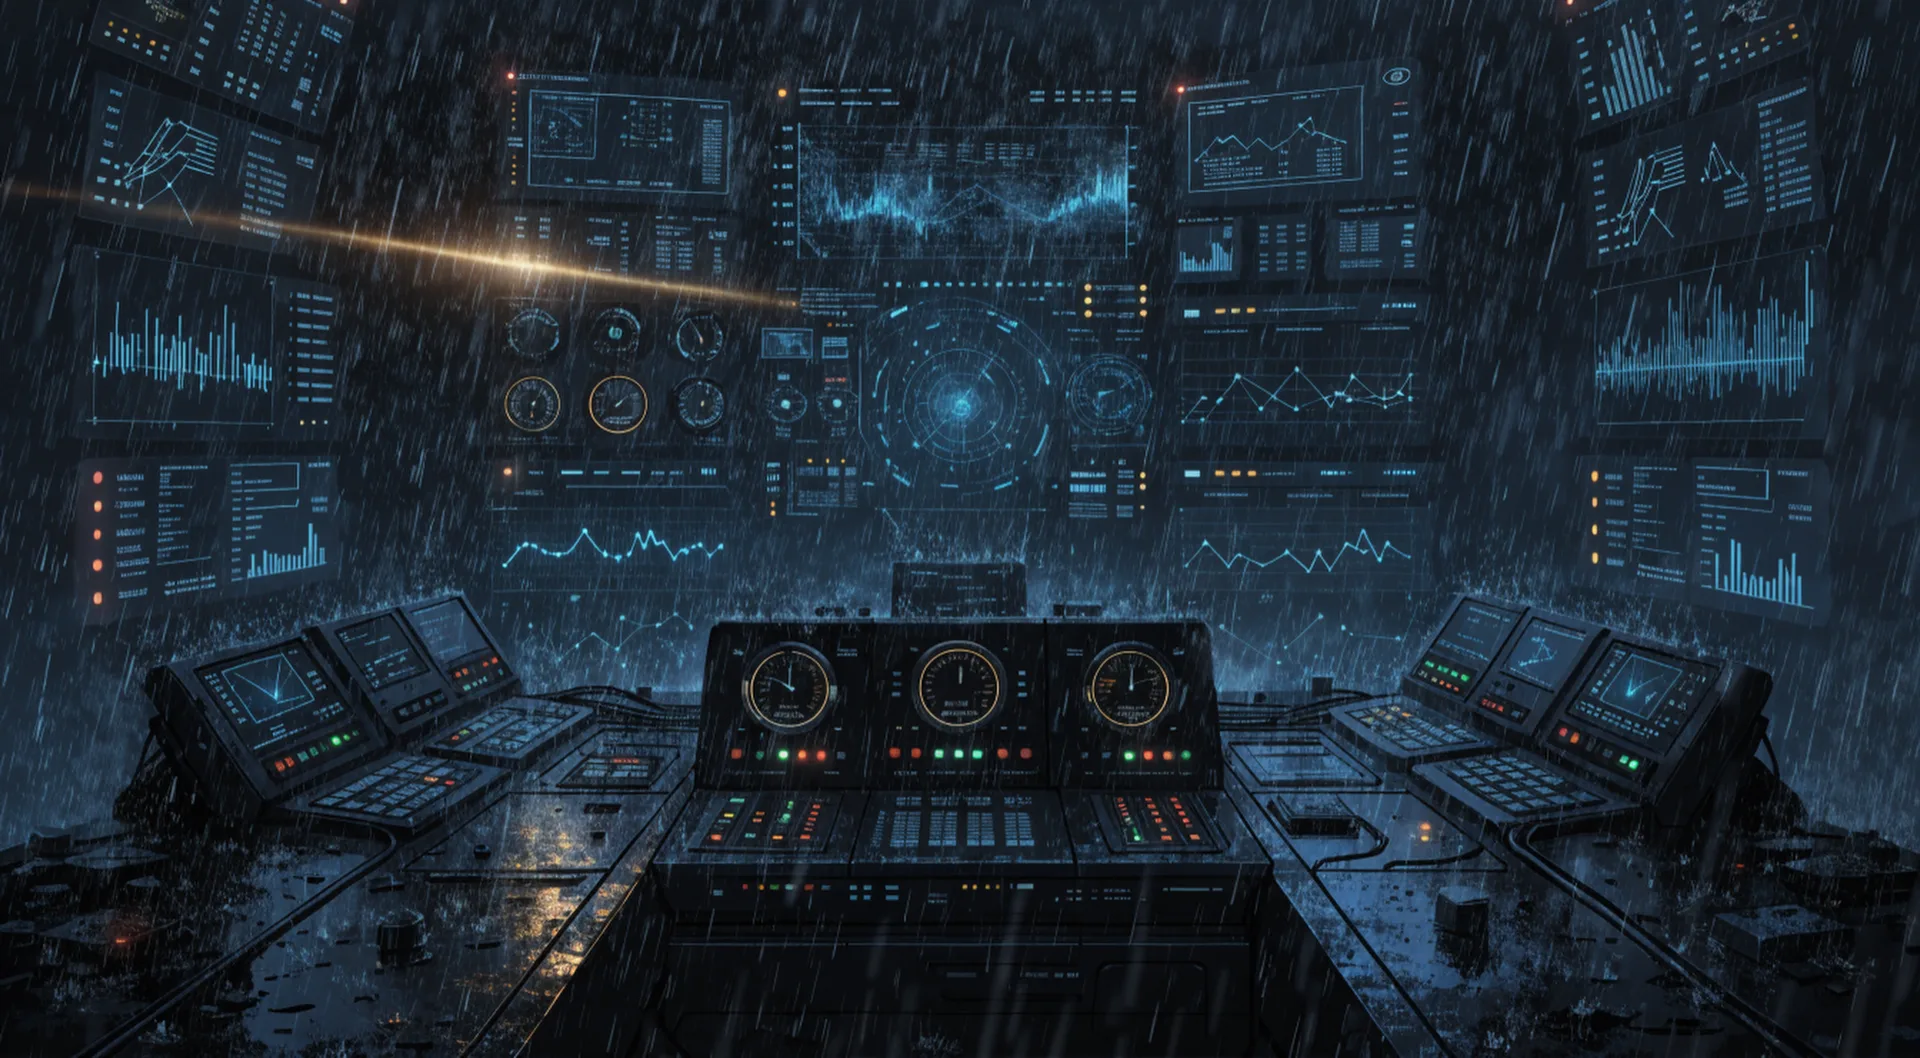
Every analytics tool ever built shares one assumption: you will come and look. The dashboard sits there, complete and silent, holding the answer to a question you haven't asked yet. Miss a day and the error spike from Tuesday waits politely until Friday, when it's already cost you three users and a weekend.
That assumption just broke, and it's worth paying attention to how.
Pull was always the weak link
Hyperdrift runs a fleet of small apps steered by one founder and a crew of agents. Every morning a Commander cycle reads the last 24 hours — traffic, blockers, session replays — and produces a verdict: did the last change work, and what's the next move?
It's a decent system with a built-in flaw: it only finds what it queries for. The morning read asks the questions we thought of when we wrote it. Anything outside that list — a new error class, a weird referrer surge, a form nobody finishes anymore — stays invisible until a human gets curious. Curiosity doesn't scale to a fleet.
Signals flip the direction
PostHog's self-driving beta turns the warehouse into a source of observations. It watches error tracking, replays, and logs on its own schedule, and when something is off it emits a signal — one plain sentence, like "Error rate spiked 3× on /apply." Signals cluster into reports. Reports can wake agents.
Read that again from the tooling side: the analytics platform now produces language, not just numbers. A sentence with a timestamp and an embedding is something an agent can act on directly. No insight-building, no query-writing, no human in the loop deciding what's worth a look.
So we wired it in. This is the Bridge — the panel our Commander cycle reports to every morning, one ship per app, with the daily read and its evidence behind each card:
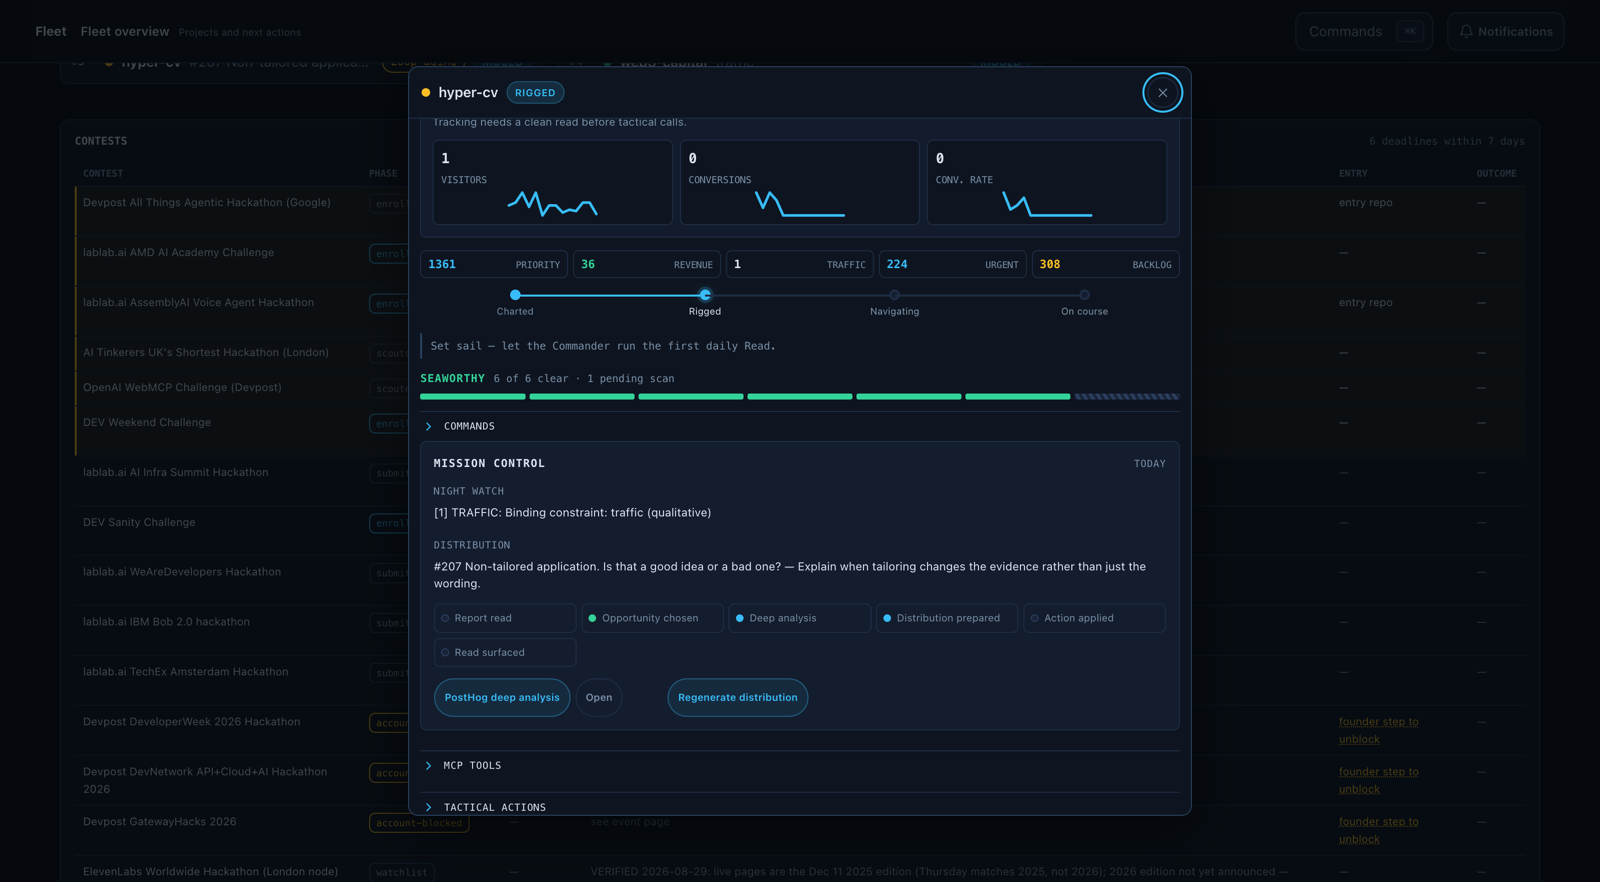
Our Commander's daily read now carries a signals block, pulled since the last release anchor — and deliberately outside the "did we ship anything?" gate. That gate made sense when evaluation was pull-based: no change, nothing to evaluate. Signals are push-based. The whole point is that the platform can notice something on a day you shipped nothing.
How the wiring works
Signals live in PostHog's document_embeddings table, queryable over HogQL. Each row is a versioned observation: content, source product, report id, a 1536-dim embedding. The Commander gathers them with one dedup query (argMax by inserted_at, metadata extracted inside the subquery) since the evaluation anchor, falling back to a 7-day window. The function degrades to {available: false} on any failure — the daily cycle must never die because a beta API hiccuped.
The integration reused our existing HogQL client. Total new surface: one query, one function, one key in the read brief. When the store is empty — self-driving is opt-in, enabled per project by npx @posthog/wizard self-driving — the block reports zero signals and the read proceeds as before.
Honest edges
It's a beta and it acts like one. Signals only flow after you opt a project in, the setup wizard wants an interactive terminal and GitHub access, and the fix-it agents charge $15 per pull request they ship. We're starting narrower: signals as evidence in a read a human still judges. The agent earns the keyboard later.
What to take from this
Stop treating analytics as a page you visit. Treat it as a feed your agents subscribe to. The primitive to build against is the signal — a natural-language observation, queryable in SQL, cheap to route into whatever loop already runs your product. Ours took an afternoon to wire because the loop already existed. If yours doesn't, that loop is the thing to build first.
We'll publish what the signals actually catch once they've had a few weeks on a live app. If you're wiring agents into a real product and want to compare notes, talk to us.